When you select State Summary, the Report Criteria available to you are identical to those for a Species Seen report, except that the Place criteria is not allowed because the Places (all states and provinces) are implied in the report. You will be prompted “Do you want species detail? (Y/N)_”. If you answer Y, the following detail of species seen, by state, will be output first: (Just a fragment is shown here, as displayed in the high speed Screen Viewer.)
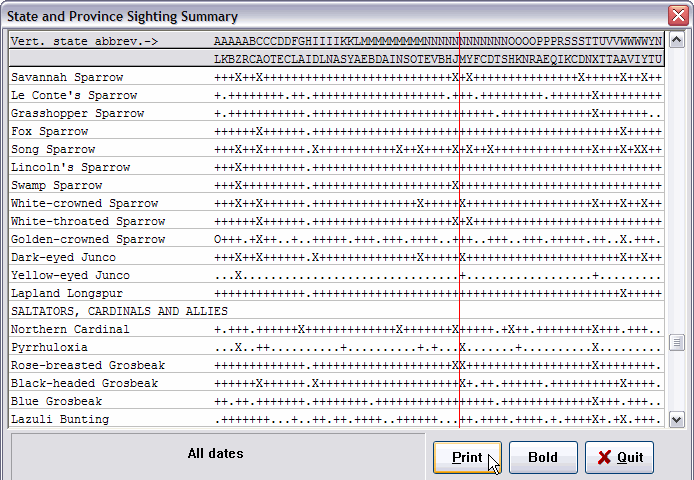
This report shows detail of the states and provinces in which each species has been seen by you. The states are depicted by vertically arranged state and province abbreviations across the top, AL for Alabama being listed first, and YT for Yukon Territory listed last. The state abbreviations are listed in the alphabetic order of the full state name, not the order for the abbreviation, so there will be some discrepancies in alphabetic sequence. In the interest of legibility, the state code legend is repeated three times on each page when printed to paper or preview.
Each column has an ‘X’ when a species has been seen in the state heading that column, within the date range, etc., selected for the report.
In the case shown here, the user responded Yes to Do you want to show checklist markers? So, the state checklist status for each bird is also marked. The coding is thus expanded as follows:
Note the Golden-crowned Sparrow in the illustration. If this user had run a Species Seen report with the California Checklist invoked, the Golden-crowned Sparrow would have been called out as an accidental because it was recorded in California but is not in the California checklist. That "accidental" status shows up in this report as an O.
Frankly, this report is terrible to read. Nevertheless, it is the best way to present the required 244,000+ data points in one report of single page width. If you have a lot of sightings in just a few states, then the state columns will become obvious to you. But, if you have many sightings in many states, then you will probably need a straight edge—or great eyes.
However, if you use the Screen Viewer, you can click the crosshair cursor between two state columns to place a red guideline so you can easily see a particular state’s position in the column. Note the guideline set up between New Jersey and New Mexico in the illustration.
You might find the actual state summary to be much more useful. It is presented by itself, or at the end of the report when state detail is requested.
                             STATE/PROVINCE SIGHTING SUMMARY
                                       All dates
                 CHECKLIST/SPECIES SEEN COUNT BY STATE/PROVINCE/REGION

  Alabama...........392.....   Maine.............408.....   Ohio..............398.....
  Alaska............445.....   Manitoba..........372.....   Oklahoma..........447.....

  Alberta...........377.....   Maryland..........403...52   Ontario...........459.....
  Arizona...........511...89   Massachusetts.....460.....   Oregon............466..134
  Arkansas..........380....1   Michigan..........401.....   Pennsylvania......387.....
  British Columbia..466...32   Minnesota.........414.....   Prince Edward Is..310.....
  California........588..299   Mississippi.......391.....   Quebec............417.....
  Colorado..........455.....   Missouri..........392.....   Rhode Island......395.....

  Connecticut.......389.....   Montana...........388...22   Saskatchewan......360.....
  Delaware..........387...42   Nebraska..........417.....   South Carolina....400.....
  D.C...............311....4   Nevada............445...42   South Dakota......398.....
  Florida...........473..137   New Brunswick.....380.....   Tennessee.........374.....
  Georgia...........394.....   New Hampshire.....371.....   Texas.............592.....
  Hawaii............187...29   New Jersey........425...60   Utah..............389...46

  Idaho.............362.....   New Mexico........480...92   Vermont...........351.....
  Illinois..........414...51   New York..........442.....   Virginia..........414.....
  Indiana...........395.....   Newfoundland......366.....   Washington........443..102
  Iowa..............393.....   North Carolina....426...11   West Virginia.....317.....
  Kansas............435.....   North Dakota......373.....   Wisconsin.........399.....
  Kentucky..........349.....   Northwest Terr....301.....   Wyoming...........402....1

  Louisiana.........439.....   Nova Scotia.......432.....   Yukon Territory...260.....
The top portion shows the checklist and seen counts for each of the states and provinces.
The bottom portion shows the regional seen counts and “total ticks,” as well as species seen counts, for various geographic areas of interest to birders. Total ticks are the summations of the species counts for the states and provinces in the areas defined.
            Eastern Canada       0            Southwest USA      141
            Central Canada       0            So. Central USA      1
            Western Canada +AK  32            Southeast USA      140
            Pacific Coast USA  317            Northeast USA      111
            Rocky Mountain USA  90            No. Central USA     51

                                      Total           Species
                                      Ticks *         Seen

                  ABA North America...1217.............417

                  N.A + Hawaii........1246.............426

                  U.S.A incl. Hawaii..1214.............426

                  U.S.A w/o Hawaii....1185.............417

                  Lower 48 states.....1185.............417

                  Canadian Provinces....32..............32

     * Total Ticks is the summation of state species counts.
The regions are as defined in the ABA Regional Checklists:
| Eastern Canada | PQ, NF, NS, PE, NB |
| Central Canada | ON, AB, MB, SK, NT |
| Western Canada+AK | BC, YT, AK |
| Pacific Coast | CA, OR, WA |
| Rocky Mountain | ID, MT, CO, WY, NV, UT |
| Southwest | AZ, NM |
| So. Central | TX, OK, LA, KS, AR |
| Southeast | VA, NC, SC, GA, FL, AL, MS, TN, KY |
| Northeast | ME, NH, VT, MA, RI, CT, NY, PA, NJ, DE, DC, MD, WV |
| North Central | ND, SD, NE, MN, IA, MO, WI, IL, MI, OH, IN |
Provides a one page summary of sightings, by state. Criteria, such as date range and Attributes, can be used to limit the report to specific records. Optionally produces species detail of all seen species, showing the states where each was seen. Optionally adds state checklist markers to the above.
Produces species detail of all N.A. species, showing the states that include the species in their checklists. Optionally adds sighting markers. Criteria cannot be used . The State Checklists report is similar to the State Summary report when species detail and state checklist markers are requested. In fact, the differences are a little subtle, with the basic difference being that the State Summary shows seen species only, and produces a summary page.
When these reports are sent to ASCII file, they are sent in straight ASCII format, exactly as you see them in the viewer.