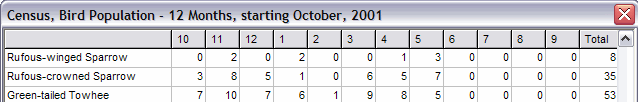
Census reports create spreadsheets of either bird populations (based on quantities you enter in sighting records) or sighting incidents (where each sighting record counts as one incident, regardless of the quantity in the comments field.) This selection is made with the Quantity and Incidents radio buttons in the Report Criteria menu.
The other criteria are selected as in Species Seen reports, except that the date entry method is different to accommodate the unique requirements of these reports—individual months, years, and or year counts are entered at prompts.
Note: When directed to ASCII (Text) file, Census reports are actually exported in a comma delimited text interchange format so that your census data can be poured into other spreadsheet or database programs, such as Excel, Access, 123, Paradox, etc.
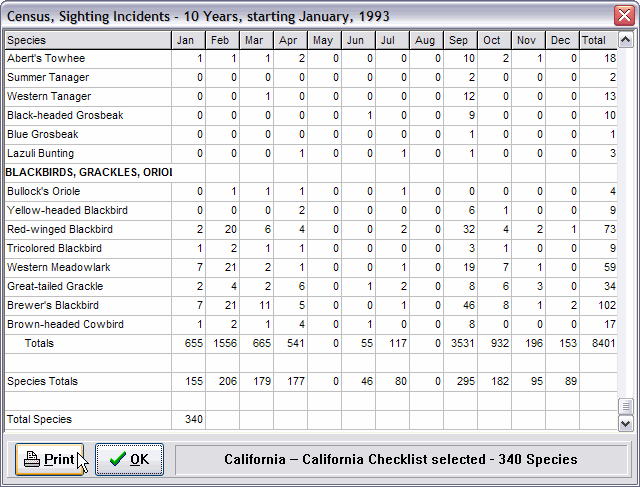
The report above is a N-Years by Month Census, of Sighting Incidents, for the 10 years starting in 1993, in California. The N-Years by Month report can include sightings for up to 99 years, but it always starts with January.
In Census reports, the Checklist selection is used only to restrict the census to the species marked (included) in the invoked checklist. This feature can be used to do special species group studies, such as a warbler population study. (See Chapter 3, The Master Checklist - Custom Checklists for more information.)